I sat down to write a satirical blog post, but the results I got disturbed me.
I used the Geonet quake catalogue to download the past 5 years of New Zealand earthquake data from http://info.geonet.org.nz/display/appdata/Earthquake+Catalogue
library(dplyr)
library(lubridate)
library(ggplot2)
if(file.exists("eqnz.csv")){
  eq <- read.csv("eqnz.csv", stringsAsFactors=FALSE)
} else{
  e1 <- read.csv("http://quakesearch.geonet.org.nz/csv?bbox=163.03711,-49.32512,182.41699,-32.47270&startdate=2015-09-01&enddate=2016-09-01", stringsAsFactors=FALSE)
  e2 <- read.csv("http://quakesearch.geonet.org.nz/csv?bbox=163.03711,-49.32512,182.41699,-32.47270&startdate=2014-08-01&enddate=2015-09-01", stringsAsFactors=FALSE)
  e3 <- read.csv("http://quakesearch.geonet.org.nz/csv?bbox=163.03711,-49.32512,182.41699,-32.47270&startdate=2013-09-01&enddate=2014-08-01", stringsAsFactors=FALSE)
  e4 <- read.csv("http://quakesearch.geonet.org.nz/csv?bbox=163.03711,-49.32512,182.41699,-32.47270&startdate=2012-10-01&enddate=2013-09-01", stringsAsFactors=FALSE)
  e5 <- read.csv("http://quakesearch.geonet.org.nz/csv?bbox=163.03711,-49.32512,182.41699,-32.47270&startdate=2011-09-01&enddate=2012-10-01", stringsAsFactors=FALSE)
  eq <- rbind(e1,e2,e3,e4,e5)
  write.csv(eq, "eqnz.csv", row.names = FALSE)
}

#the posix time conversion was not coping with the decimals on the second so this is chopped to the nearest second
eq$etime <- as.POSIXct(gsub("\\..+","",eq$origintime), format="%Y-%m-%dT%H:%M:%S", tz="GMT")
The data I am using is unmodified except for truncating the decimal places on the second of the origin of the earthquake.
topic <- c("From", "To", "total entries")
fact <- c(as.character(min(eq$etime)), as.character(max(eq$etime)), as.character(nrow(eq)))
knitr::kable(data.frame(measure=topic,amount=fact))| measure | amount |
|---|---|
| From | 2011-09-01 00:18:03 |
| To | 2016-08-31 23:56:37 |
| total entries | 101936 |
So, five full years (so the same amount of each solar cycle) and a little over 100000 earthquakes to work with.
I had been planning on writing a satire by selectively whittling down the dataset by restricting the magnitude range and other features, but I started by making a graph of all the data
eq$eqhour <- hour(eq$etime)
eq %>% group_by(eqhour) %>% summarise(count=n()) %>%
  ggplot(aes(x=eqhour, y=count)) + geom_line() + ylim(0, 7000) +
  xlab("Hour (GMT)") + ylab("Number of NZ earthquakes")
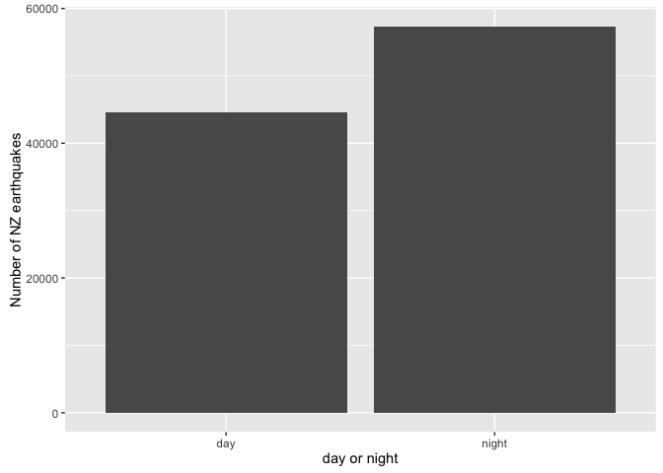
Woah. That is actually a pattern. And not even a little, hard to see pattern. That is a consistent, sustained, increase of a quarter in the rate of quakes. And thus a different result to other countries.
The graph is in GMT, and if we call night-time in New Zealand approximately from 7pm local time (07 GMT) to 7am local time (19 GMT) the difference is even starker.
eq %>% select(eqhour) %>% mutate(daynight= ifelse(eqhour >= 7 & eqhour < 19, "night", "day")) %>%
  group_by(daynight)%>% summarise(count=n()) %>%
  ggplot(aes(x=daynight, y=count)) + geom_bar(stat="identity") +
  xlab("day or night") + ylab("Number of NZ earthquakes")
eq %>% select(eqhour) %>% mutate(daynight= ifelse(eqhour >= 7 & eqhour < 19, "night", "day")) %>%
group_by(daynight)%>% summarise(count=n()) %>% knitr::kable()| daynight | count |
|---|---|
| day | 44615 |
| night | 57321 |
Treating this as a test of 101936 earthquakes, we can do a binomial test to assess the chance of this result if the sun is not having an effect. As it is for the sun having a affect (but we don’t care if daytime is more or less earthquakes) we will make it two sided.
eqp <- binom.test(57321, 101936)The p-value is rather extreme (R reports a p-value of less than 2.2 x 10⁻¹⁶, because floating point numbers get inaccurate when you get to small, but I see the number it calculates it out as is 9.88 * 10-324). From this I am forced to reject the idea the the sun is not making a difference.
Some premeditated questions:
Why is this the case in New Zealand and not other countries
I don’t know, I’m not a geologist (actually at this stage no one knows as no one seems to have noticed this). But as wild speculation- maybe it is that New Zealand is so geological active things get set off that do not do so in other places.
Why does it increase at night
I don’t know, I’m not a planetary physicist. Wild speculation again- maybe it is the difference between pulling the crust into other crust when the sun is below the horizon, and pulling the loosening the crust when the sun is above it.
What does this mean for earthquake prediction
I prediction around 11 out of 20 earthquakes in New Zealand will be at night. Speaking as someone in central Christchurch for the Feb ’11 quake, I respect the awesomeness of modern building codes and prefer to be in modern buildings.
How about the effect of the moon
The sun’s gravity is an order of magnitude stronger than the moons (it is a lot further away, but it is much, much, much larger). If you are trying to make the moon a causative agent and have not fully accounted for the exact affect of the sun in a given instant, I have my doubts about the rigour of your work.
You haven’t established causality, despite the headline
Quite right. I have actually noted there seems to be a relationship. However, I don’t believe earthquakes cause night-time.
Is this a real effect, or a clever satirical statistical stunt
This seems real to me. I used all the data I got, I didn’t pick out any subgroups and make claims only about those groups without explaining why the mechanism does not apply to others, I haven’t done anything remote clever to the data beyond put in the obvious groups and count it up.
Can this be studied in more detail
Absolutely- One should actually figure out the exact angle of the sun to the epicentre given the point in the solar cycle, the seasonal axial tilt of the planet, and the daily rotation. This is a very broad brush.
Did these results surprise you
Yes. Oh yes. I did this expecting to write up a non-result.
Other questions, you will need to pose yourself in the comments.
…and in response to a comment below I am adding a graph of the percentage of earthquakes at night for each (rounded) .1 step in magnitude
made with the code
eq %>% select(eqhour, magnitude) %>% mutate(daynight= ifelse(eqhour >= 7 & eqhour < 19, "night", "day"), rmag = round(magnitude,1)) %>%
 group_by(daynight, rmag)%>% summarise(count=n()) %>% spread(daynight,count) %>% mutate(perc=100 * night/(day+night)) %>%
 ggplot(aes(x=rmag, y=perc)) + geom_line() + ylim(0, 100) + xlim(0,7) +
 xlab("magnitude") + ylab("percent of night-time earthquakes")
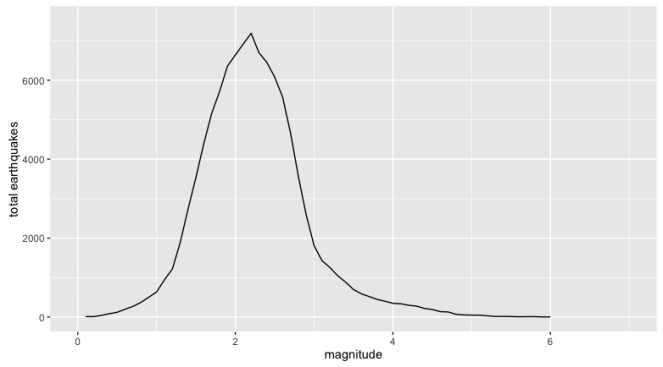
This should be read keeping in mind the number of quakes in the data for each step
eq %>% select(eqhour, magnitude) %>% mutate(daynight= ifelse(eqhour >= 7 & eqhour < 19, "night", "day"), rmag = round(magnitude,1)) %>%
 group_by(daynight, rmag)%>% summarise(count=n()) %>% spread(daynight,count) %>% mutate(perc=100 * night/(day+night)) %>%
 ggplot(aes(x=rmag, y=perc)) + geom_line() + ylim(0, 100) + xlim(0,7) +
 xlab("magnitude") + ylab("percent of night-time earthquakes")
So the increasing uncertainty at the ends makes sense with a number of samples explanation.


Really interesting! Does this hold for different magnitudes of earthquake? Ie what does the day/night graph look for 3+ magnitude or 4+ magnitude? There could be biases caused by tools for smaller/imperceptible earthquakes
LikeLike
Keeping in mind that magnitude is essentially a log scale, so rounding down to the nearest magnitude (which I just did to test that) is a little weird in terms of steps. It holds up 1-3 and then gradually decreases from 4, however 5 (and even more so 6+) are comparatively rare events so I would be less trusting of the finer decimal places of the frequency.
LikeLike
I added some graphs to the post
LikeLike
The extra graphs are interesting. Obviously the variability at the ends is due to the lack of events. Where there are solid numbers (from 1.5 to 3), the relationship appears to be a straight line, and (eye-balling it) it seems plausible that the straight line is applicable if extended up to 6 (less so if extended the other way).
LikeLike
The gravitational force of the moon on the earth is larger than that of the sun. This is illustrated by tides. Although the position of the sun is relevant for tide heights, the position of the moon is most important for tide times.
I wonder if earthquake rate correlates with daily tidal range. The rock of the earth does respond to the combined gravitational pull of the moon and the sun, in a similar way to the water. If there is an effect due to gravity, I would expect more earthquakes when there is a higher rate of change in the net gravitational force on the rocks, not when there is a maximum or minimum.
100000 quakes in 5 years is an awful lot of tremors. That’s 2 every day. They must be counting some pretty small ones. Like Merrin, I suspect some kind of detection bias. Maybe the detectors have to be set to less-sensitive during the day to avoid being set off by large lorries. Maybe the detectors are “counting” some man-made tremors.
I just did a google search on this subject. You might like this article http://timesofindia.indiatimes.com/home/science/Earthquake-counts-go-up-as-moon-comes-closer-to-earth-BARC/articleshow/6786972.cms
LikeLike
I’m going to disagree with that- the gravitational attraction of the sun is much greater than the moon- that is why the earth orbits the sun rather than the moon. Newton’s equation is (mass Moon * mass Earth) / (distance squared) compared to (mass Sun * mass Earth) / (distance squared). The sun is a lot further away, but it is much, much, much, much bigger. From back of the envelope calculations the gravitational attraction of the sun is about an order of magnitude greater.
However, because the moon is closer than the sun the change in distance squared over the course of the day (the approximately 12000 km change in distance caused by a point on the surface rotating from near to the object to far from the object) is a much larger proportion of the gravitational attraction. And that radius of the earth based change in distance fluctuation is why we have tides.
However (a second level of however), for items on the crust of earth itself, doing the maths you also need to take into account the “gravity sink” of the earth itself and the rotational inertia of the points on the surface. The gravity well of the earth is about the only part of the maths that is constant with working out the vectors of how the forces play out, but the cancelling or amplifying affect of the earth is relative to the at the time position of everything else.
LikeLike