A report I was just looking at had both a big methodological hole, and a subtler thing to be careful of, and a mistake most people make. I thought it worth while to write up all three.
Eye tests and road accidents
The New Zealand Ministry of Transport is looking at getting rid of eye tests as part of driver’s licence renewal, in favour of a declaration that “my sight is under control”
As part of the discussion around this the released a report
which since it is Crown Copyright and thus freely reproducible I will also link to this copy in case the original withers and dies due to embarrassment
Driver-Licensing-Review-Crash-Studies-Impacts-of-Vision-Testing
A direct quote from page 1 is “Internationally, there has been little research conducted about the safety impacts of vision testing for drivers other than older drivers. The purpose of the crash rate analyses below was to develop evidence of the safety impacts of vision testing for the general population of drivers in New Zealand. The analyses indicate that there is no discernible benefit from repeated vision testing as part of the driver licensing process.”
The analysis looked at the number of reported injury accidents in the past three years of licencing renewal, and the three years after, comparing people who passed the eye test with people that failed the eye test then passed after getting glasses. So
Proportion crashing who renewed licence with no sight correction vs Proportion crashing who renewed licence with sight correction required.
They found that the difference between the groups was not significant so rejected the alternative hypothesis that the people who had to have their vision corrected crashed at a different rate to those that didn’t, and so conclude that having the eye test is making no difference to crash rates.
The big problem
You may be thinking “I’m sure there is something wrong with this” and you would be correct. The big problem lies in the comparison of people who passed the eye test at renew uncorrected against people who failed the test then subsequently passed it after vision correction. There is a group that has been excluded from the data in this comparison- the people whose vision was too bad to pass the test. These are the actually hazardous people because they have the worst sight, ranging from just fails the test to totally blind.
These people might be voluntarily giving up driving because they know their sight has deteriorated. The might be going and being tested at an optometrist or doctor’s and failing there and not seeking renewal, or they might be going to the renewal office and failing there. However, they came about not renewing their licence, we can get a sense of the overall numbers by comparing, by age group, the number of people with drivers licences against the number of people in the population.
The sources are the New Zealand Ministry of Transport 2015 figures of drivers licences by age group
https://www.nzta.govt.nz/resources/new-zealand-driver-licence-register-dlr-statistics/ licence holders as of 30th June 2015
and the population statistics from Stats New Zealand Inforshare http://www.stats.govt.nz/infoshare/ Population – Population Estimates DPE – Estimated Resident Population by Age and Sex (1991+) (Annual-Jun) for the population as at June 2015
Combining the two we get:
| agegroup | nzpopulation | licencees | percent | |
|---|---|---|---|---|
| 1 | 15-19 | 316800 | 149730.00 | 47.26 |
| 2 | 20-24 | 338660 | 294815.00 | 87.05 |
| 3 | 25-29 | 312310 | 320927.00 | 102.76 |
| 4 | 30-34 | 286990 | 314958.00 | 109.75 |
| 5 | 35-39 | 273780 | 289194.00 | 105.63 |
| 6 | 40-44 | 309250 | 327149.00 | 105.79 |
| 7 | 45-49 | 313250 | 313551.00 | 100.10 |
| 8 | 50-54 | 318530 | 324660.00 | 101.92 |
| 9 | 55-59 | 287300 | 275936.00 | 96.04 |
| 10 | 60-64 | 250150 | 239223.00 | 95.63 |
| 11 | 65-69 | 225740 | 203739.00 | 90.25 |
| 12 | 70-74 | 165200 | 147668.00 | 89.39 |
| 13 | 75+ | 283400 | 182845.00 | 64.52 |
Clearly this is an approximation- the licence holders are for both class 1 and 6 (so double count) and do not take into account international migration, and the population estimates are approximations. However, it is the trend line that is important.
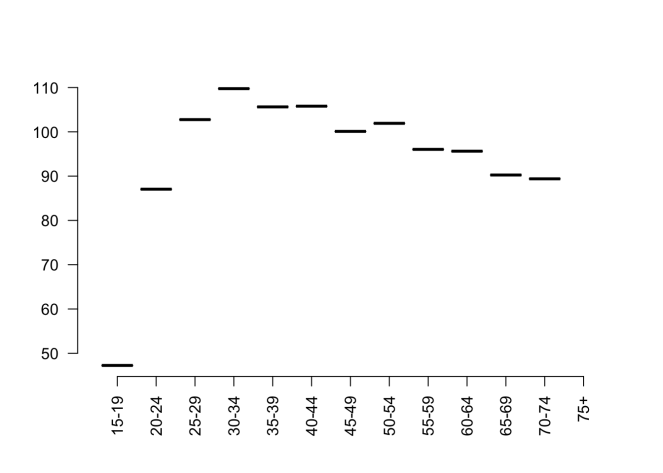
From the age group 30-34 there is a steady decrease in the number of licences held by each age group, at an average rate of -2.54 per five year period. Or to put it another way, in 2015 an estimated approximately 327327 of currently living licence holders (or 8.89 percent of the 2015 over 15 population) no longer have their licence. It is this population that the objective eye test protects against. While not all of these people no longer have a licence due to sight issues, the people who no longer have a licence due to sight limitations are included in this number.
The the minor problem of entropy
Eyesight gets worse over time, which means the further into the past you trace the people who needs glasses to renew, the more their eyesight resembles that of a person who did not need vision correction. After a point any differences between the group are swamped by the length of time the vision is similar.
Also, because injury traffic accidents are a relatively rare event the ‘sample’ over a small period of time is small and so it is difficult to ‘disprove the Null Hypothesis’ (for the reason for the quotes, see the next point).
No evidence is selected for picking the period of three years. A good analysis would describe the period at which there was the greatest difference.
The thing everyone does but shouldn’t
There was no point in conducting a hypothesis test. A hypothesis test is an estimation of the true population parameters on the basis of the similarities in the sample groups. These are not sample groups. These are the population. The differences between them are the actual differences. There is no estimation that the true population differences are 0 or not, we know them. Now there are different questions that do have uncertainty, like the amount of variation in accident rates across years and the degree to which that reflects underlying trends vs random variation, but that wasn’t what was investigated. I realize lots of people use hypothesis testing as measure of distance between population groups, and I am in the minority to be pedantic about this.

It can’t be that 99% (678920/(678920+7437)) of “Drivers passed eyesight test at agents and granted licence without condition to wear lenses”. Our collective eyesight isn’t that good. Maybe they mean that those drivers already had the corrective lenses needed?
LikeLike
See for example: https://www.cbs.nl/en-gb/news/2013/38/more-than-6-in-10-people-wear-glasses-or-contact-lenses
LikeLike
Sorry for all the multiple comments but I can’t find a way to edit. Ignore above: On looking at it again, I see that there seem to be three groups, and they are leaving out the group that passed with corrective lenses. It’s still a problematic comparison since there’s no reason to assume that people who can pass the test without glasses have better vision than those who need lenses to pass. In fact, if their prescription is current, the latter are likely to have better vision than those who don’t need lenses to pass the test. This is due to the fact that lenses fine tune vision and correct for things that are not tested in most simple vision tests, such as peripheral vision. In any case, interesting post! Thanks for pointing out such bad science.
LikeLike
They meant 2 groups:
1) 7437 people who failed without corrective lenses and got corrective lenses and passed
2) 678920 people who passed the eye test for renewal without needing correction.
For people who already needed glasses and continued to have glasses and passed, there is not enough of group one for them to be in group one, and it is unclear if they are misleadingly included in group 2 passed without needing corrective lens (… because they already had them is unspoken) or misleadingly excluded entirely. I suspect because this is people relicensed in 2011 they are probably included in group 2 (no eye problems) because of the size of the group. But that is just a guess. As you note, this is a third group that creates ambiguity in the study.
The fourth group, the one I identified of people who didn’t get their license renewed (including those whose vision could not be corrected to a sufficient level) are clearly excluded.
LikeLike