This is the last part of my Getting and Cleaning advice
- Part 1 : General Advice
- Part 2 : Getting and Cleaning Week 1
- Part 3 : Getting and Cleaning Week 2
- Part 4 : Getting and Cleaning Week 3
- Part 5 : Getting and Cleaning Week 4
- Part 6 : Getting and Cleaning the Assignment
This part is my compendium of useful information about the course Project.
I am posting this now as some people ask assignment questions in the first week (but I want to say, take the time to consider the content in the course in depth).
While I am not teaching staff, since when I the first test run of the course I have CTA’d in every public run, so have seen the points where people get confused (I have also scored full marks on the assignment each time I did it). So this is my advice. It includes all the main question I can recall being asked over the various sessions.
I want to make it clear though, this is not a guide to what you need to do to do the assignment, this is a guide to to doing the assignment in a way to get as reliable a mark as possible when graded by peers- you could meet the rubrics with less, but you are also leaving more to the judgement of your peers (and thus gambling on that judgement).
But, as well as being a guide to this assignment, it should also be seen as a guide to how to approach assignments on Coursera for any paper, and the golden rule is “Make it Easy for Your Markers”. Your markers will give your points if you make it clear how the assignment meets the criteria, but this signposting and spelling out how an assignment fits the rubric is a learned skill. It takes people years of high school to learn to write University quality essays, so there is some reflective learning to be had to get good at this. What we are discussing in here is the gold-plated plan to make sure your markers know you have done the right thing, when it comes to doing marking, you may well encounter more ambiguous assignments.
- Where do I begin?
For many people this is the first time you’ve encountered an open assignment, where parts of it are up to you. Think of it as getting an early chance to exercise some professional judgement under controlled conditions. Or, if you prefer, think of it more like writing an essay at University level- your choice of references is up to you in writing about a topic. In a similar way, your choice of steps is up to you to address the analysis. A bit like it being a good idea to plan out an essay, it is a good idea to plan out the analysis: break the requirements down to steps, work out what to do for each step, do that step (and check it worked). Just like doing an essay, a bit of background reading can be a good idea. The data file includes a readMe, it wouldn’t be a bad plan to read it and have a think about how the data matches to it. As a “first draft” you might read in the data files and check what the dimensions of the data is, for how they will fit together.
Take it step by step, get each step sorted before moving on.
- The explanation is as important as the script, so make sure you make a ReadMe
Some people have lost marks in previous courses for not making it easy for their reviewers to give them marks. Don’t just make a tidy data set, make it clear to people reviewing it why it is tidy. When you given the variables descriptive names, explain why the names are descriptive. Don’t give your reviewers the opportunity to be confused about your work, spell it out to them.
- How do I put the data together
If you are clipping data together, you often want a clipping data together function like rbind() or cbind(). To work out how various parts (x files, y files, subjects, train vs test) flow together try reading in the files and looking at their dimensions with a command like dim(), by matching sizes like lego bricks there really are a very limited number of ways the data can fit together even if you haven’t read the ReadMe (p.s. read their ReadMe).
- Do we need the inertial folder
Short answer- no. Long answer- If you work very hard you can attach this very raw data to the more processed train and test X data, but a subsequent steps calls on you to get rid of all the variables that are not to do with mean or standard deviation (worked out from the column names- the features) and you have no names for those columns so they go. Seems a lot easier just to not include them in the first place.
- can I have multiple scripts
Though most people keep everything in one script, people have, in the past created separate scripts and used source() commands to bring it all together. If you are varying from the obvious spec it is really, really important to make it clear how what you are doing is within the brief for the assignment, so explaining how it is run_analysis that is doing the work and what the various parts are contributing.
- what columns are measurements on the mean and standard deviation
Based on interpreting column names in the features is an open question as to is the the entries that include mean() and std() at the end, or does it include entries with mean in an earlier part of the name as well. There are no specific marking criteria on the number of columns. It is up to you to make a decision and explain what you did to the data. Make it easy for people to give you marks by explaining your reasoning.
- Is descriptive activity names things like “Walking” and “Walking Up”
Yes, you need to get the activity numbers in the data and replace them with descriptive terms which are words. Now, a lot of people watch the merge lecture in week three, and decide to use it in a “I am rushing through without checking each step kind of way” and fail to notice merge reorders the data (this is something you also might see in the week 3 quiz if you are paying attention). If you have not yet clipped all your data together (because you are doing the steps out of order) this will mean the things you are clipping together will be in a different order. If you are doing the steps in the set out order, you will never see this problem though. You can also apply the labels with subsetting. Another strategy is adjusting factor levels, or other even more exotic techniques.
- Is step 4 the same as step 3?
I am going to say no
Since it say labels the data set it is talking about the variable names (which at the moment are V1, V2, etc if you have be following the steps in there numbered order. Descriptive variable names means names based on the action the variable is recording, for example the Jerk of the body on the z axis of the phone. In general, the more descriptive is going to be the better. once again make it easy for your markers by noting why they are descriptive names (what they mean goes in the code book).
- Is an average of a standard deviation even a thing?
Short answer. Doesn’t matter, you are being asked to produce a average for each combination of subject, activity, and variable as a sign you can manipulate the data. Long answer, yes it is a thing.
- Is it the first data set or the second we upload?
Up load the set created in step 5. This is an independent set of data created by taking the results of step 4 and making a new set of averaged data. Step 4 is internal to the script only.
- Are you sure either the wide or narrow form of the data is tidy?
This question only makes sense when you have watched the reshaping lectures in week 3.
Yes. The wide or narrow form is tidy. The wording in the rubric has actually been clarified on this point to help people be clear in marking. Tidy data is one of the more important concepts in the is course. Go back and read Hadley Wickham’s Tidy Data paper (not that you have read this at the start of the course, but it is recommended reading in the lectures in both week one and week three before the assignment is due). It talks about how the specific form of “tidy” depends on the problem being solved, and this problem permits two forms. I have my own elegant proof of this which the margins do not have room for. If you want to bulletproof yourself on this point for the assignment, I am also going to start a similarly verbose thread about tidy data in the next few days. And that gives you something you can assert in your readMe citing the weblink to the discussion (hardly anyone cites things, but it is actually a brilliant plan). That, people, is how you make sure there is no ambiguity for your markers.
- should the saved text file look that weird?
Tidy data is not made to be looked neatly at in programs like notepad (which is often the default for text files on windows), but if you saved the file with write.table according to the instructions, the command for reading it in and looking at it in R would be
    data <- read.table(file_path, header = TRUE) #if they used some other way of saving the file than a default write.table, this step will be different
    View(data)
A person wanting to make life easy for their marker would give the code for reading the file back into R in the readMe. A person who varied the write.table settings should definitely help their marker by giving the variant instructions for reading the file in. A person careful about ethically noting their sources might cite this thread (though that is a pretty minor bit of code). There are fancier ways of reading the file in, like from a web address on the clipboard, but that is probably a topic for a stand lone thread if people were really curious, rather than extending this thread.
- wasn’t there a Code Book?
Yes, and it is really important you include it. Go back to quiz 1 and look at the codebook there for inspiration. Be sure it goes on github with the analysis script and the readme. People have lost major marks in previous sessions by having a brain-fade and forgetting about critical files so not getting the marks: you want a run_analysis R script, a ReadMe markdown document, a Codebook markdown document, and a tidy data text file (this last goes on Coursera).
Feel free to start a thread about what a good codebook is.
- Is anyone else seeing the y or subject data file as gibberish
You must be on Windows using notepad. Notepad is not a very clever text editor, and can only cope with basic Windows text encodings. Use Notepad++ as a high quality free Windows text editor (if you want a good free Macintosh one I would suggest TextWrangler)
- Should I decompose the variable names
No. For two reasons. One is that no-one ever does so correctly. The other is that you need to write a really excellent ReadMe and Codebook that makes it clear to your markers how what you’ve done is tidy, and for reasons of the first part this is a problem. This is one of those ideas that is better in theory than in practice. People (possibly inspired by the tidyr swirl tutorial) go “I can split the x,y, and z, and all the others into different columns”. The trouble in practice is that you don’t actually get clear one variable per column because the the entries in each column are not independent, mutually exclusive, members of the same set. It is like seeing red, dark green, light green, pink, and blue as categories and thinking it is a good idea to make it tidier by putting the light and dark in a separate column. You introduce a bunch of NA values for all the other entries, and introducing a bunch of NA values where there were not previous ones (or a functional equivalent term like “other”) is a pretty clear sign the data is a best no tidier (and is probably worse).
- And Submit
This isn’t a question, but there are two buttons at the bottom of the assignment “Save draft” and “Submit for grading”. You have not submitted your assignment until you tick the honor code tickbox and “Submit for grading”. If you do not actually do this step you will miss out on all the marks for the assignment.
- Have I ruined my data?
There are ways you can put the data together where it all goes wrong. All subjects should have done all activities. That is a pretty good rule of thumb. If you want to share an aggregate mean value for a paritcular subject/activity/measurement combination, go right ahead. But the all subjects did all activities normally covers potential problems.
- Why do I keep saying “make it easy for your markers”?
Because it is one of the basic principles of doing peer assignments for any course (not just this one). Most people want to give you marks, and if you actually explain about why your project meets the requirements they will know you have thought about it and be happy to give you marks (even if you did the project differently to them).
- Can I vigorously defend what I believe to be the one truly tidy arrangement of the data
Go right ahead. But please keep it to the discussion forums rather than carrying it into how you are marking (and please start another thread for that). This can be one of those times where people overestimate their understanding of the structure of the data if you are certain of your opinion. I’ve been helping out in this course for a year and I think it is arguable. What we are marking for is the data tidy- nicely categorised data so we can do an analysis easily- has it got headings that make it clear which column is which, is it one column per variable (though what the variables are will be different in the long and wide form), is it one row per observation (though what the observations are will be different in the long and wide form). Tidy data is not a certain number of rows and columns, if the question was looking for that, the rubric would specific it (that said, for example if their data left out entries because they didn’t include the test data, the data set might be tidy but the script itself would have a serious flaw).
- My Link, it does nothing
For those who have not done assignments on Coursera before, when you load a file in it is stored as a link that is inactive during the submission phase. This becomes an active link in the marking (evaluation) phase. If you want to test it during the submission phase you can Preview the assignment, or right-click on the inactive link and “Open in new window”.
If you do every change an existing submission on Coursera, be a bit careful that you cleared out the old submission properly. If you select a link and paste over it, most web browsers will take this as replacing the text of the link rather than the hyperlink of the link. Either completely clear out the old link before adding a new one, or use the link tool to control the hyperlink bit.
Tidy Data and the Assignment in Detail
I personally think the concept of tidy data is one of the most important parts of the course, because if you have your data in the right form it can make an analysis easy, but you need to understand how the data can flow between the various shapes. It is also an area where there can be a number of different correct answers.
I think database people have a much easier time with the idea of tidy data because the have been exposed to the various normal forms. That said, we aren’t dealing with the fourth normal form in this, and we don’t want to try and press gang the material into it (for a start we are wanting to produce a single table at the end).
One distinction between the 4th normal and tidy data, is that the domain is much more important in data analysis- what problem am I actually trying to solve. As Hadley notes in his article, there can be multiple forms of a set of data that are tidy, but the best specific form (in terms of rows and columns) is conditional on the problem you are trying to solve. Tidy data is data that supports being easily reorganised to apply specific analysis techniques on (such as the reorganising of data week 3 lectures, or the grouping data dplyr Swirl tutorial in the Getting and Cleaning set).
I would also suggest that, as well as the Hadley article which is a must read, people tackle the tidyr tutorial in the Swirl Getting and Cleaning Data set (though I would suggest people tackle them all (for example the dplyr get you familiar with reorganising tidy data)) as a hands on fixing data tutorial.
Now, how I think about the data:
1 – I would say it is better to think of the problem as involving three sets of entities – subjects, activities, and readings and we are trying to get tidy data that represents a summary value (mean) for the intersection of each set. But this is because I think set theory (basically drawing venn diagrams about the entities involved) is a very useful lens for how to think about the tidiness of a set of data.
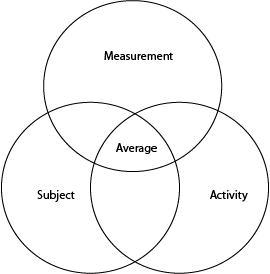
In fundamental set theory speak, we are looking at the intersection of the three sets Subject ∩ Activity ∩ Measurement
2 – For this assignment we are only using the features involving the standard deviation and the mean as a subset of all the available features. imagine a small circle in the centre of the above three circles intersection.
3 – I would say they are discrete members of the set of observations, as it is possible for an action to change a y direction reading in the phone without changing a x or z direction reading (though practically that would be really hard).
A brief example
Let’s take the mtcars data
data(mtcars)
mtcars
Looking at it, I think we would all describe that as wide data.
Now let’s restrict the number of variables
narrow <- mtcars[, c("cyl", "gear", "vs", "mpg")]
narrow
Suddenly it looks a lot more like long (or narrow) data.
Now let’s say we are wanting to summarize the data, finding the maximum value of mpg for each combination of cyl, gear, and vs (there are, as you will know from the week 3 lectures, a lot of ways you could do this, I happen to like reshape2)
library(reshape2)
wide1 <- tidied <- dcast(narrow, cyl + gear ~ vs, max)
wide1
Putting aside that when there isn’t an entry max goes to -Inf and we should probably fix that, replacing with NA, this is wider than the original.
But if we go
wide2 <- tidied <- dcast(narrow, cyl + vs ~ gear, max)
wide2
That is the same data, arranged differently.
There is also
wide3 <- tidied <- dcast(narrow, gear + vs ~ cyl, max)
wide3
Same data, arranged differently.
For that matter, there is also
notverywide <- aggregate(mpg ~ gear + vs + cyl, data = narrow, max)
notverywide
A visual difference is that aggregate removed the -Inf entries, but for this the important issue is that it is the same narrow shape as the original.
Now, lets thrown in a clearly untidy result (though up until now we have only been talking long and wide rather than tidy)
untidy <- with(narrow, tapply(mpg, list(cyl, vs, gear), max))
untidy
Which I hope we can agree that dividing up the answers across multiple tables is not what we want (it may be useful in some cases, and the answers are correct, but the outcome is not one single tidy table for output).
So what’s going on with the long/wide thing? This all falls back ultimately to set theory. In this case we have a set of (cyl) a set of (vs) and a set of (gear). Imagine a cubic stack of boxes where the first dimension (width) is arranged so all the same cyls are at the same place going across, the second dimension (height) has all the same vs boxes at the same height, and the third dimension (depth) has all the same gears arranged at the same depth as we walk down the side of the cubic stack. Inside the boxes are the mpg readings for that combination of cyl, vs, and gear.
When we reshape this data, we can lay all the boxes out in a long line recording where they came from in the cubic static (so recording the cyl, vs, and gear) with the mpg still in the box. This is the long form.
In the wide forms above, we are laying out the data in a two dimensional arrangement, where one of the variables is the width and combinations of the other two are the height (With purely numeric data we could actually make a 3 dimensional matrix as well, but that is a little beyond the scope of this discussion).
There is a follow on to this- when we are reshaping our data we are changing the details of what our observations are (what the rows are). This is to do with where in Hadley Wickham’s paper he talked about some of the issues with tidy data being problem specific (to do with the question we are trying to answer). Some arrangements of observations are going to be better at address a particular problem than others. So within the broad set theory background it becomes what is the best tidy form of data to answer a specific question
So what does this mean for the assignment?
The assignment wants you to “creates a second, independent tidy data set with the average of each variable for each activity and each subject”
The purest tidy for is a little difficult to say, since we don’t have a specific problem to apply it to, but it hinges a little on what a “variable” is- are the variables independent measurements of activity/subject actions (the form the data comes in), or are they members of a set of measurements variables (in a similar way that each activity is a member of the set of activities, as in the diagram, upthread)
Depending on the interpretation, this could support either data in the wide (first) or the long form (second) being in tidy format, and the marking rubric specifically accepts wide or long. In previous sessions most people were opting for wide. Regardless of the form you choose, the strategic way of approaching the question (in a learning to do peer assignments to maximise your marks kind of way) is:
- In the submission box, as well as the link, put some accompanying text on another line something like “tidy data as per the ReadMe that can be read into R with read.table(header=TRUE) {listing any settings you have changed from the default}” This is just to make it really easy for your reviewer.
- In the readMe in explaining what the script does put “and then generates a tidy data text file that meets the principles of …etc”
- the truly cunning may want to put in a citation to this discussion and/or Hadley’s paper
- The codebook still has the specific description of the tidy data file contents (and you mention that it exists and it’s role in the ReadMe)
This follows the general peer assignment on Coursera study habits of making it easy for your markers to give you marks by spelling out to them why they should give you marks.
It also means that (I think) people should be reasonably generous in marking the tidy data aspects. Many forms are tidy, you have to do something like wind up with subject and activity in the same column to be untidy (which can happen with some methods), or a series of tables, or extra unlabelled columns (which can also happen with some ways of generating summaries if you do not then remove them afterwards). My own checklist is:
- Does it have headings so I know which columns are which.
- Are the variables in different columns (depending on the wide/long form)
- Are there no duplicate columns
There is really not much more to tidy data
A few more thoughts
- If things are part of the same set they should actually have the same units (by definition). OTOH all the assignment data has been normalised.
- People sometimes are interested in dividing up the measurement into a set of columns (decomposing), dividing up labels is actually a little different to dividing up data (you are not just pivoting sets around you are trying to break them into cohesive subsets)- you will find you are introducing a lot of NA values if you try this, which is generally a sign that the approach isn’t working.
Bonus Round: Easy Marking
Over in the FAQ thread I mentioned people could put the code for reading the tidy data into R into their readMe
But if you want to get fancier than that:
If you right click on a file name in the submission box and copy the web address, you can paste it into a script.
address <- "https://s3.amazonaws.com/coursera-uploads/user-longmysteriouscode/asst-3/massivelongcode.txt"
address <- sub("^https", "http", address)
data <- read.table(url(address), header = TRUE) #if they used some other way of saving the file than a default write.table, this step will be different
View(data)
In theory, if you have a library like psych installed and loaded it is fairly easy to read the data off the clipboard (I haven’t checked this with every possible computer though)
library(psych)
address <- read.clipboard.tab(header = FALSE, stringsAsFactors = FALSE)[1,1]
address <- sub("^https", "http", address)
data <- read.table(url(address), header = TRUE) #if they used some other way of saving the file than a default write.table, this step will be different
View(data)
The above examples assume they used write table without setting the delimiters, if they did something like that (or used write .csv and changed the file extension) hopefully they noted that somewhere so you know how to read their file into R.
From experience, I would also add that if some of your markers (and assignments use median so one marker getting it wrong will not effect the overall result) are going to misunderstand things, they are more likely to misunderstand that the long form is tidy (even though it expressly says either the long or wide form is tidy) because the data started as wide form and they have a bit of trouble grasping that measurements can be a vairable. So as strategy advice, if you are using the long form and want to strongly guide your marker, I would add clear references “this is the long form as mentioned in the rubric as either long or wide form is acceptable”

This is really, really helpful. Thank you! Is this the file that you refer to as an example of a codebook from Quiz 1? https://d396qusza40orc.cloudfront.net/getdata%2Fdata%2FPUMSDataDict06.pdf My understanding was that the codebook should include more narrative about the script and choice made than this does.
LikeLike
YEs, that is what I meant. It has the key elements of which columns are which and what kind of thing is in the columns. It describes the data. Yes, it is on the spartan side but thinking about the script may be better in the ReadMe.
LikeLike
This was the single most useful explanation to both creating a marking the assignment. Thank you.
Fermat’s last theorem was a nice surprise.
LikeLiked by 2 people
after all this, what is the dimension of the tidy data you have formed. My dimensions looks like 35,88. (Row/Column)
Everybody found that dramatically different like 180,81 —- 11880, 11 —– 79 , 127. I going to do peer review after see these things I am really confused.
https://github.com/uludagy/GettingandCleaningData
LikeLike
There is not correct answer to your question- as discussed elsewhere, tidy data is not about a certain dimensions, it is about data meeting the tidy data rules. In this case people could be treating it as wide or long (either of which is fine) and choosing their won definitions of columns relating to standard deviation and mean. Those decisions affect the dimensions, but they have nothing to do with the tidy data rules from elsewhere in the course.
LikeLike
Is the script just the commands, or is it wrapped in a function?
LikeLike
That, when I was involved with the course, was not specified in the assignment instructions and there were no marks associated with any specific question around that, so it was open to however people wanted to approach it.
LikeLike
In your explanation about average of standard deviations, your “short answer” is much longer than your “long answer.”
LikeLike
Hello I suppose y_test and y_train values are descriptive values for all rows separately. I added those values as a new column to data sets. Then I changed the numbers 1,2,3,4,5,6 with descriptive activity_labels like Walking, Walking Upstairs. Is it true? Wanted to be sure thanks
LikeLike